Summary of Fluorescence Quantitative PCR (qPCR) Questions
1. What is background correction? How often do you perform background correction?
The background correction program measures the blank fluorescence intensity of the reaction tube and water used by the quantitative PCR instrument. During the calibration procedure, the quantitative PCR instrument continuously reads the fluorescence intensity of the background calibration plate within 10 minutes, and the signal collection temperature is 60°C. Subsequently, the SDS software calculates the average value of the collected fluorescence intensity, extracts the result and saves it to the calibration file. The software will automatically call this correction file in future analysis to subtract the background signal from the experimental data.
Because the signal intensity of background fluorescence varies with many external factors (such as foreign pollution, different reaction plate/reaction tube manufacturers, water purity, etc.), it is recommended to perform background correction regularly, generally every three months to half a year. once.


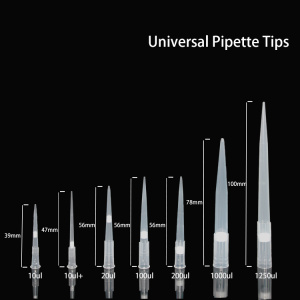
Quantitative PCR experiments can use the following consumables: 96-well optical reaction plate with optical film, 0.2 ml optical eight-gang reaction tube with optical film, 0.2 ml optical eight-gang reaction tube with flat optical eight-gang tube cover.
3. Why do I need to defragment my computer regularly? How to organize?
When running the real-time quantitative PCR instrument and using the software to analyze the experimental results, the computer will delete and create several files, and the free space of the computer hard disk will be divided into more and more small pieces. When files on the hard drive are stored in broken fragments, it takes longer for the program to access the files, because the file fragments must be searched for multiple times to access different fragments. The defragmentation utility merges multiple fragments of a file and stores them in the same location on the hard disk, thereby removing file fragments and optimizing system performance.
The method of defragmentation is as follows:
· On the Windows desktop, select start, My computer.
· In the (My Computer) window, right-click the hard drive and select (Properties) property.
· In the (Properties) dialog box, select the Tools (Tools) tab, and click Defragment now.
· Click Defragment.
· When the "Defragment Complete" dialog box is displayed, click (OK).
· In the "Local Disk Properties" dialog box, click (OK).
· Repeat the above steps for the remaining drives in the computer.
4. When will the windows service pack update be performed?
Do not perform this operation. Please do not update the operating system of the computer that controls the quantitative PCR machine unless you are notified by the representative of Applied Biosystems to update the operating system. The new version of the Microsoft Windows operating system may conflict with the SDS software and cause the instrument to fail to operate normally. If you want to install a service pack (update package) to update the operating system, you should check the version description provided with the SDS software to avoid compatibility issues.
5. What data should be backed up?
Your experimental data should be backed up regularly. The recommended backup frequency is once a week and burn it with a CD. At the same time, you should also back up the various pure fluorescence spectrum calibration files, background files, and installation verification experimental data of the quantitative PCR instrument. The directory where these files are located is C:/Appliedbiosystems/SDS Document. The figure below is a sample of the calibration file.
6. What kind of laboratory environment can ensure the normal operation of equipment?
A good laboratory environment helps to extend the service life of the instrument and reduce the frequency of instrument failure. The following aspects are recommended:
Power supply: It is recommended to be equipped with a suitable UPS or voltage regulator.
Ventilation: The ventilation of the instrument should not be blocked.
Temperature: It is recommended that the laboratory be equipped with air conditioning, and the temperature should be controlled between 10-30°C.
Humidity: 20-80%; for humid provinces, it is recommended that the laboratory be equipped with a dehumidifier.
Space: easy to operate and safe.
7. How to judge whether the sample heating block of the quantitative PCR instrument is contaminated? How to remove pollution?
One way is to run a background correction reaction plate. When one or more reaction wells continuously show abnormally high signals, it indicates that the well may be fluorescently contaminated.
Another method is to perform ROI correction without placing any objects on the sample block. When the signal of a certain hole is significantly higher than other holes, it indicates that the hole is contaminated.
The steps to remove contamination of the sample heating block are as follows:
Pipette a small amount of ethanol and drop it into each contaminated reaction well.
Beat it several times.
Suck the waste liquid into the waste liquid cup.
Repeat the above steps: ethanol three times and deionized water three times.
Confirm that the remaining liquid in the reaction well has evaporated.
8. What is the power-on sequence of the quantitative PCR machine?
Follow the correct power-on and turn-off sequence to help prolong the service life of the instrument and reduce the frequency of instrument failures.
Power-on sequence: Turn on the computer first, and then turn on the quantitative PCR instrument host after the computer is fully started. After the green light on the host panel is on, you can open the quantitative PCR collection software and perform the experiment.
Shutdown sequence: After confirming that the experiment has ended, first turn off the signal collection software, then turn off the power of the quantitative PCR instrument host, and finally turn off the computer.
9. What is pure fluorescence correction? How often does it take to calibrate?
Pure fluorescence calibration is to measure the wavelength and signal intensity of various pure fluorescent dye standards. In layman's terms, it allows the instrument to "recognize" various fluorescent dyes. The software collects and stores the fluorescence information of various pure fluorescent dye standards. In each subsequent run of a quantitative experiment, the SDS software collects the original spectrum signal of the sample, and compares the original spectrum with the data in the pure fluorescence file, and accurately subtracts the signal overlap of different dyes to determine the type of fluorescent dye in the sample And signal strength.
It is recommended to perform a pure fluorescence calibration every six months. Before running spectral correction, please perform background correction and ROI correction first.
10. How to seal the 96 well plates?
When using 96 well plates for experiments, it is recommended to use optical films instead of lids to seal the reaction wells. The correct sealing method is: first press the film along the longitudinal direction of the 96 well plate, then laterally, and finally press along the edge of the plate to seal it.

11. When using a single tube or 8-connected tube for experiment, how should I arrange the placement on the sample heating block?
When using a single tube or 8-connected tube for experiment, and the number of samples is not large, it is recommended to place the samples symmetrically on the sample heating block (TRAY), preferably vertically, and preferably in the 6th or 7th column. Then gradually place it to both sides. The advantage of this is that the hot cover will not tilt when it is pressed down, and the force and heat of each reaction tube are relatively uniform, which improves the precision of the data between the holes.
12. What is the difference between absolute quantification and relative quantification?
The purpose of absolute quantification is to determine the number of molecules of the target gene in the sample, which is commonly referred to as the copy number. The purpose of relative quantification is to determine the relative proportion of the content of target genes in two or more samples without knowing the number of copies of them in each sample.
For example, if the research project includes processed and unprocessed control samples, the unprocessed sample can usually be designated as the benchmark, the target gene concentration is specified as 100%, and the quantitative result of the processed sample is divided by Based on the quantitative results of the control sample, the percentage of the gene content of each processed sample relative to the unprocessed sample can be calculated.
Absolute quantitative experiments must use absolute standards with known copy numbers, and a standard curve must be drawn. Relative quantification can be used as a standard curve or not.
There are two methods for relative quantitative experiments: standard curve method and CT value comparison method. If you use the standard curve method, you can use absolute standards or relative standards, and relative standards are easier to perform in experimental operations. A relative standard is a standard that only knows the dilution ratio of DNA or RNA in the sample without knowing the number of its molecules. The typical approach is to make a series of serial dilutions of a sample with a known pg number.
The CT value comparison method uses the mathematical relationship between the CT value and the logarithm of the initial DNA concentration to calculate the relative percentage between different samples. The calculation formula is.
Absolute quantitative data is easy to understand, but it is difficult to prepare absolute standards and determine their DNA content. There are many commercial standard kits for purchase, which can solve this difficulty.
Relatively quantitative standards are easy to prepare in the laboratory, but data processing is more troublesome, and it is difficult to interpret experimental data.
13. How should the experimental data of quantitative PCR gene expression be processed?
In general, there are three levels of correction that must be done.
First, the reference signal is corrected. The reagent must contain a fixed concentration of ROX, so that the fluorescence signal fluctuations caused by the difference in the total volume of the reaction, the position of the hole, the thickness of the test tube wall, the difference in the light transmittance of the tube cover, etc. can be deducted, so that The data truly reflects the PCR process. ROX correction can greatly improve the accuracy of quantification and increase the reproducibility of data between repeated tubes.
Secondly, internal control correction. The samples added in the experiment are basically based on volume, but different samples of the same volume are likely to come from different numbers of cells, so it is necessary to correct the experimental results to the content of each cell. The method is to quantify an internal control gene (such as 18S RNA gene) while quantifying the target gene (such as IL-2), and then IL-2/18S. The internal control calibration allows the experimental data of different samples to be compared with each other.
Third, calculate the relative gene content relative to the reference sample (Calibrator). For example, to study the difference in gene expression between treated and untreated, 0 hours and 6 hours, normal and diseased, you need to calculate treated/untreated, 6 hours/0 hours, diseased/normal.
14. How to deal with the relative quantitative data of the standard curve method?
Assuming that the goal of the experiment is to study the changes in IL-2 gene expression in a certain tissue at 0, 24, and 48 hours after drug treatment, the internal control used is the 18S RNA gene.
15. What is the CT value comparison method? How to deal with the data?
The CT value is inversely proportional to the logarithm of the starting DNA concentration:
If (1) the PCR reaction efficiency between different tubes is the same; (2) the PCR reaction efficiency is close to 100%, the relative content (X01/X02) = 2 -ΔΔCT can be derived from the above formula. Assuming that the goal of the experiment is to study the changes in the expression of IL-2 gene in a certain tissue at 0, 24, and 48 hours after drug treatment, the internal control used is the 18S RNA gene. The results of IL-2 and 18S RNA determination are CT values, and the pg number of total RNA is not determined by the standard curve.
16. Allele identification experiments (such as SNP typing) are qualitative studies. Is it possible not to perform ROX fluorescence correction?
No, the allele identification experiment also needs to perform ROX fluorescence normalization to ensure the precision and reliability of the experimental results.
Occasional factors such as the error of the reagent loading operation, the error of the heat transfer of the centrifuge tube, the error of the light transmittance of the centrifuge tube cover, etc. are inevitable, which will inevitably lead to the difference in fluorescence excitation efficiency, so the original signal collected by the instrument must be normalized It can be compared with each other and ensure reproducibility.
This correction is achieved by adding ROX to the reaction buffer to correct fluorescence. The concentration of ROX in the reaction buffer is fixed, so the change in signal level is only related to the overall effect of the above-mentioned physical changes. Dividing the signal of the report fluorescence by the signal of the ROX fluorescence can eliminate all the data fluctuations caused by these physical factors.
17. How many kinds of probes can be added to each reaction tube?
The number of probes that can be added to each reaction tube depends on the instrument, software, reagents, and experimental design.
The first is the hardware composition of the instrument and the analytical capabilities of the software. Under the premise of sufficient software resolution, full-wavelength detection quantitative PCR instruments such as laser tube-CCD type have practically no limit on the number of probes. If the signal is collected through color filters, the number of probes depends on the number of color filters. Adding probes requires adding or changing color filters. It is often difficult to modify the structure of the instrument. Take the instrument of AB company as an example, 7900 and 7700 are laser-full wavelength detection, 7000 and 7300 are 4-color filters, and 7500 are 5-color filters.
The second is the chemical possibility. Different fluorophores should be combined together and used in the same reaction tube, and their excitation wavelengths must be relatively close and not too close, to ensure the efficiency of signal excitation and ensure that the signals do not overlap and interfere, so that they can be clearly distinguished. The types of fluorescent groups that have been discovered are limited, and there are fewer molecular combinations that meet this condition. The current best combination can only reach the level of 4 to 5 fluorescence per group.
The third is the design of the experimental program and the type of probe selected. Quantitative PCR experiments must use ROX to correct fluorescence, which takes up one type of fluorescence; the quenching group (TAMRA) of the TaqMan probe also takes up one type of fluorescence. For a 4-color detection instrument, only two types of fluorescence are left for labeling. Probes, there are 3 kinds of fluorescence that can be used for 5-color detection instruments. If the probe is changed to TaqMan MGB probe, since its quenching group is non-fluorescent, one more fluorescence can be used to label the probe than TaqMan probe. If the experimental requirements are not high, do not do ROX correction (AB company does not recommend this), you can also use another kind of fluorescence to label the probe.
The fourth is to study the requirements of the application itself. If you study SNP and gene mutations, because most human genes are 2-state and only two alleles exist, two probes are enough. If you study gene expression, usually pairwise comparisons are the majority, such as treated vs. untreated, normal vs. abnormal, etc., plus an internal control, three colors are enough.
Finally, there are requirements for cost control. The purpose of multiple quantification is to improve the accuracy of data and to save reaction costs. The more genes tested at the same time, the lower the cost. But to add 4-5 probes, 8-10 primers must be added at the same time. When designing primers, it is necessary to consider as much as possible to minimize the competition and inhibition between these primers and other interferences, and to balance the PCR efficiency between each pair of primers. Although this can be done, it takes a lot of time, manpower and material resources to screen the best primer combination and optimize the reaction conditions. If the scale of the experiment is not large, it may be uneconomical on the whole.
In practical applications, it is not simply the pursuit of adding as many probes as possible, but the pursuit of the optimization of overall benefits. More practical is the 2 to 3 double reaction, the design of primers and probes is not too difficult, the optimization of reaction conditions is not too troublesome, and at the same time reduces the cost.
18. Which data is more precise, internal standard method and external standard method?
It is equally reliable. The advantage of the internal standard is that the reaction conditions of the target gene and the housekeeping gene are the closest to the same. The disadvantage is that the primers and probes of the target gene and the housekeeping gene will compete and inhibit each other, leading to their PCR efficiency.
——


